Ground-breaking diversity analysis of interior design students
The BIID publishes the first ever analysis of the diversity of interior design students at UK higher education institutions
We are delighted to announce the publication of the first ever diversity analysis of UK interior design students. The analysis is based on 5 years of data from the Higher Education Statistics Agency (HESA)*, with analysis provided by the Royal Statistical Society’s Statisticians for Society initiative. The analysis included four markers of diversity – gender, socio-economic background, ethnicity and disability - and the students analysed were those studying on BA and MA courses at UK universities. The diversity of the interior design students was compared to the entire UK student population for the same time period, in addition to architecture/planning students and all creative arts and design students.
We have summarised the key findings of the report here and the full report can be downloaded at the bottom of this article.
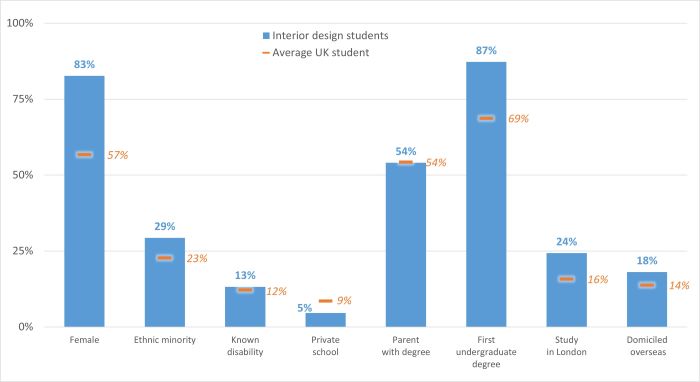
Figure 3.1: Characteristics of interior design students (where known), 2014/15 to 2018/19.
Gender
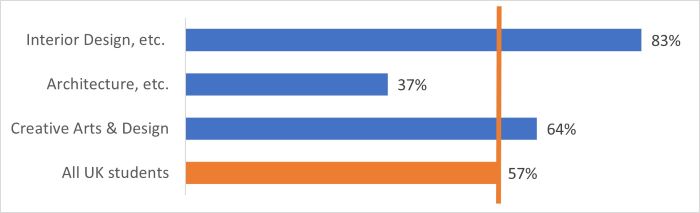
One of the most striking aspects of the data was the proportion of interior design students who were female which was 83%. This is a much higher proportion that architecture/planning students (37%), creative arts and design students (64%) and all UK students (57%). See Figure 4.1.
Figure 4.1: Proportion of students who are female, 2014/15 to 2018/19.
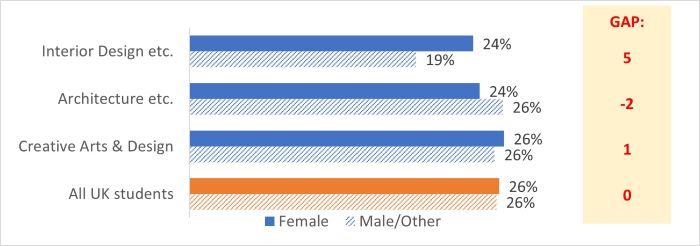
In addition, female interior design students were more likely to get a first than their male counterparts (24% vs 19%). This so-called ‘attainment gap’ was more pronounced amongst interior design students than architecture/planning students, creative arts and design students and all UK students. See Figure 4.2.
Figure 4.2: Proportion of students who gain a first-class degree by gender, 2014/15 to 2018/19.
Please note: The dataset records some students whose gender is ‘other’. However, not all universities record this information. The number of records in the data sample whose gender was ‘other’ was too small to be generalisable and therefore had not been included.
Socio-Economomic Group
UK student data includes three markers that we used to understand the socioeconomic background of a student – the type of school they attended (private or state), their parent’s level of education (school leaver or university graduate) and their parent’s employment category (a number of categories are used – from managerial to unemployed). While there are of course always exceptions, these markers are widely used in statistical analysis to understand whether an individual comes from a more or less economically ‘privileged’ background.
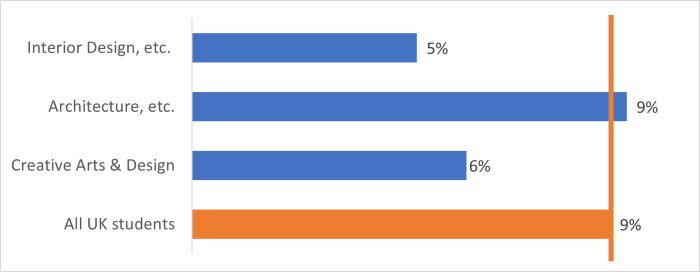
Interior design students were less likely than the average student to have attended a private school. 5% of interior design students attended private school compared to 9% of architecture/planning students, 6% of creative arts and design students and 9% of all UK students. See Fig 5.3.
Figure 5.3: Proportion of students who were at private school, where known, 2014/15 to 2018/19.
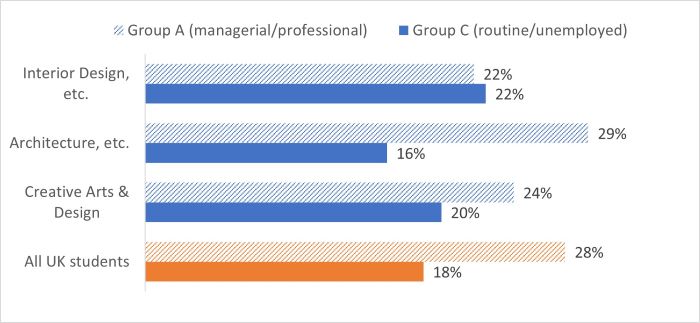
For the purposes of our analysis, parent’s type of employment was divided into 3 categories – Category A: higher managerial and professional, Category B: Lower managerial, technical or small employers and Category C: Routine, semi-routine and long-term unemployed (please see the ONS website for a further explanation of these categories). Interior design students were more likely to have parents in category C (22%) than architecture/planning students (16%), creative arts and design students (20%) and all UK students (18%). See Fig 5.2
Figure 5.2: Proportion of students with parents in employment categories A and C, where known, 2014/15 to 2018/19.
The percentage of interior design students whose parents had a degree was the same as all UK students (54%). However, it was lower than architecture/planning students (60%) and creative arts and design students (58%).
Overall, interior design students were less likely than the other students analysed to come from privileged backgrounds.
Ethnicity
For the purposes of our analysis we looked at 4 different ethnic groups – Asian, Black, Other and White.**
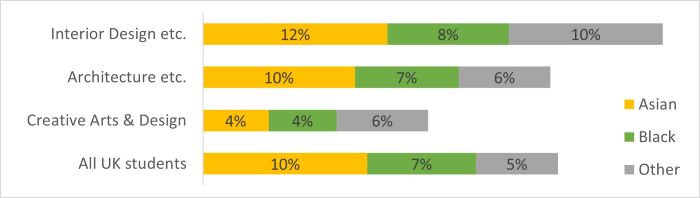
Interior design students were more likely than the average student to be from an ethnic minority background. 29% of interior design students were from an ethnic minority background, compared to the 23% of all UK students. In addition, interior design students were more likely to be from an ethnic minority background than architecture/planning students (22%) and creative arts and design students (14%). Fig 6.2 shows the proportion of students from an ethnic minority background, subdivided by ethnic group.
Figure 6.2: Proportion of students who are ethnic minority, 2014/15 to 2018/19: subdivided by ethnicity group
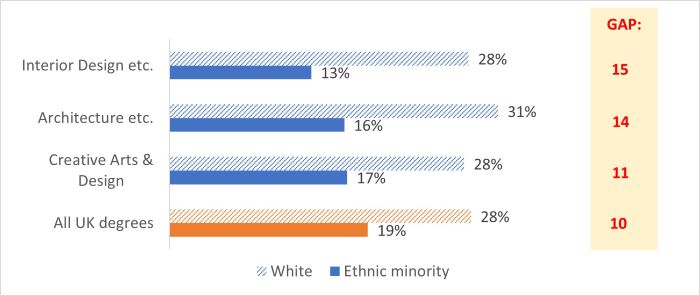
There was an ‘attainment gap’ for interior design students, as there was for all students. This means that ethnic minority students were less likely to get a first than white students. Furthermore, the ethnicity attainment gap was larger for interior design students than the other student groups we looked at. There was an attainment gap of 15 points for interior design students, versus 14 for architecture/planning, 11 for creative arts and design and 10 for all UK students. See Fig 6.3.
Figure 6.3: Proportion of students receiving a first-class degree, by ethnicity, 2014/5-2018/19
This attainment gap does not appear to be explained by socio-economic status as white students whose parents were in a lower category for socio-economic background still outperformed ethnic minority students whose parents were in the highest category.
Disability
Around 13% of interior design students reported a disability (compared to 12% across all UK students). The attainment gap for disabled students was about the same as the UK average. The data did not provide any further information on the severity or type of students’ disabilities.
Overall Picture and Next Steps
The cohort of interior design students we analysed was more ethnically diverse and featured a higher proportion of individuals from less privileged socio-economic backgrounds than the general student population for the same time period. The proportion of interior design students with declared disabilities was similar to the proportion in the general student population. The vast majority of interior design students were female compared to a smaller majority in the general student population. Attainment gaps were observed both between genders and between ethnic groups.
In terms of next steps, this analysis is only one part of the picture. We recently closed our national Diversity In Interior Design Survey, (which was launched with the intention of understanding the diversity of working interior designers, rather than students), and we will be publishing the results of that survey in early 2021. The new BIID Diversity and Inclusion Committee will begin meeting next year and they will be reviewing the research conducted and recommending next steps as part of the BIID’s long term strategy to help foster and encourage a diverse and inclusive interior design profession.
‘We are excited that the BIID is able to contribute this important research to give an insight into the diversity of UK interior design students, especially as this has been so lacking in the past. It is very encouraging to see that students from less privileged socio-economic backgrounds and students from ethnic minorities feel that this is a career for them and are choosing to study it in such high numbers. The challenge for the BIID and the wider interior design profession is how we can ensure that as many students as possible are able to go on to successful careers as interior designers, and that barriers to their success are removed.’
Lester Bennett, President, BIID
*Sources:
HESA Student Record 2015/16;HESA Student Record 2014/15;HESA Student Record 2016/17;HESA Student Record 2017/18; HESA Student Record 2018/19. Copyright Higher Education Statistics Agency Limited. Neither the Higher Education Statistics Agency Limited nor HESA Services Limited can accept responsibility for any inferences or conclusions derived by third parties from data or other information supplied by the Higher Education Statistics Agency Limited or HESA Services Limited.
Office for National Statistics licensed under the Open Government Licence v.3.0
**Ethnic backgrounds included in the ethnic groups used above:
- Asian (Indian, Pakistani, Bangladeshi, Chinese, Any other Asian background)
- Black (African, Caribbean, Any other Black, African or Caribbean background)
- Other (White and Black Caribbean, White and Black African, White and Asian, Any other Mixed or Multiple ethnic background, Arab, Any other ethnic group)
- White (English, Welsh, Scottish, Northern Irish or British, Irish, Gypsy or Irish Traveller, Any other White background)

Meet the candidates standing for election to the BIID Council in 2026
After 20 years of interior design, Emma Sims-Hilditch talks about product launches and the power of brand collaboration
Q&A with 2026 Awards Sponsors, ABI Interiors
Luxury Furniture Supplier, MSI London, is Platinum Partner with the BIID

Explore the latest, member-exclusive, templates designed to make your life easier.
NALA | The Art Matchmaker is Platinum Partner with the BIID